[OCT Observations] Optovue Solix Glaucoma Protocol #2 Dr. Julie Rodman
![[OCT Observations] Optovue Solix Glaucoma Protocol #2 Dr. Julie Rodman Image](https://blog.visionix.com/hs-fs/hubfs/Capture2.png?width=1250&name=Capture2.png)
Patient description
49-year-old Black female has been coming to the University Eye Clinic for over a decade for her annual eye care. Her systemic health is good, and she has no relevant ocular history. Over the years, she has undergone repeated testing for glaucoma, but a definitive diagnosis was never made. She reported a negative family history of glaucoma.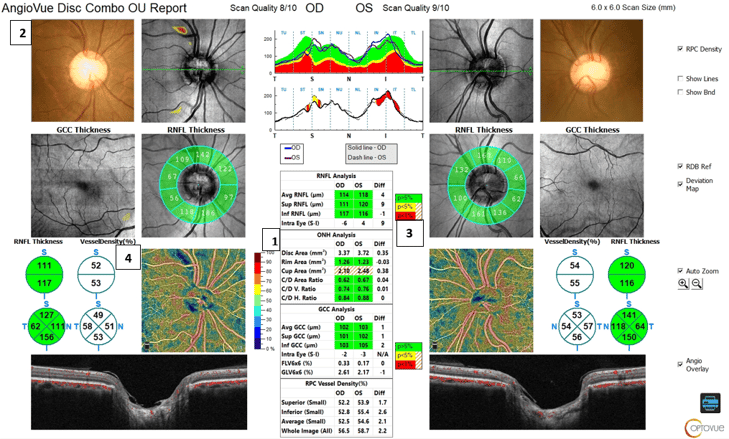
Clinical Findings
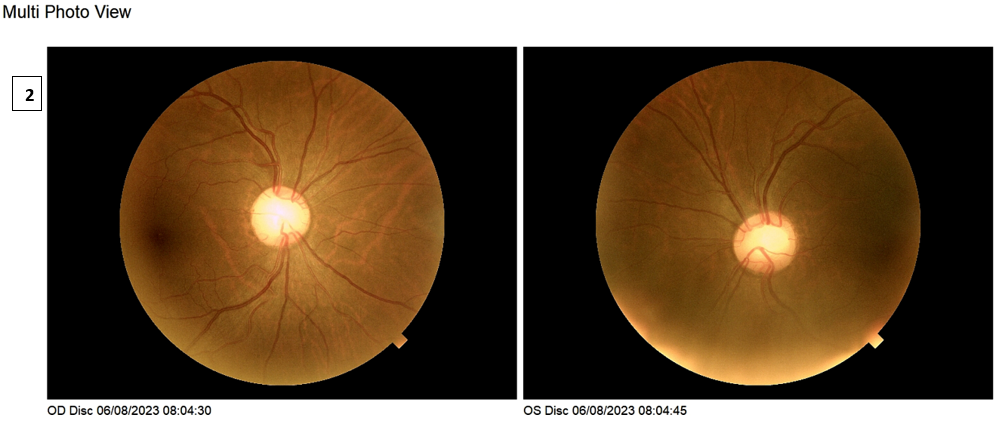
The patient’s intraocular pressure readings ranged from 11mmHg-14mmHg over the years. At the most recent visit, the IOP measured 18mmHg OD and 11mmHg OS. Pachymetry measured 476 OD and 471 OS. Her optic nerve heads were anatomically large, pink and distinct with C/D ratios measuring .80V/.80H OD and .70V/.75H OS. Solix OCT Angiography was performed to further evaluate for the presence of glaucoma.
The Optovue Solix glaucoma package provides a comprehensive analysis of the optic nerve head including disc photos, retinal nerve fiber layer analysis, ganglion cell analysis, and vessel density metrics. A single scan protocol generates both OCT and OCTA images with AngioAnalytics metrics to accurately identify damage to the radial peripapillary capillaries and track progression over time.
ONH analysis provides a metric of the disc area which allows for a quantitative measure of ONH size. For this patient, her right ONH measured 3.37mm2 and the left ONH measured 3.72mm2 (1). These numbers were consistent with anatomically large nerves. However, is there also glaucoma? At first glance, the RNFL analysis shows a robust, thick RNFL measuring 114 OD and 118 OS. The GCC analysis also looked good…. But is everything normal?
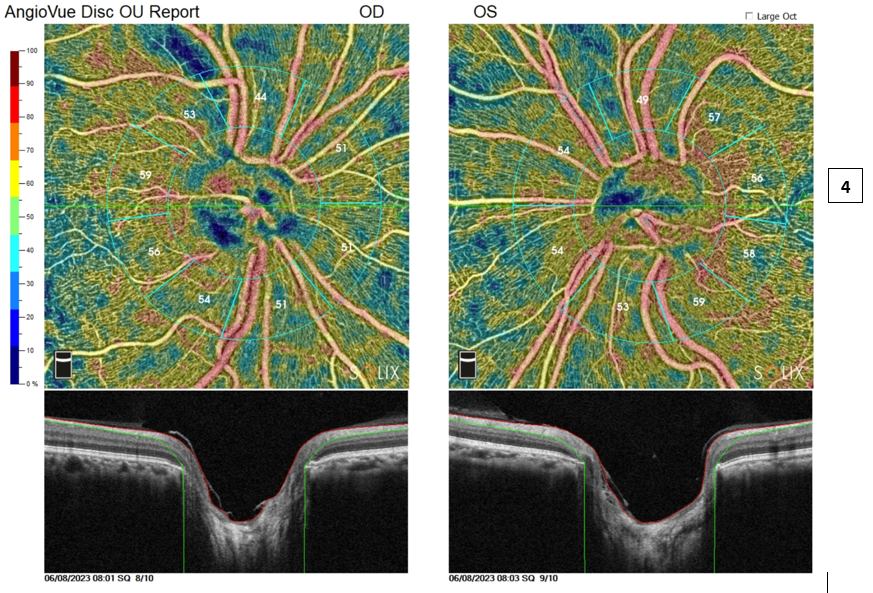
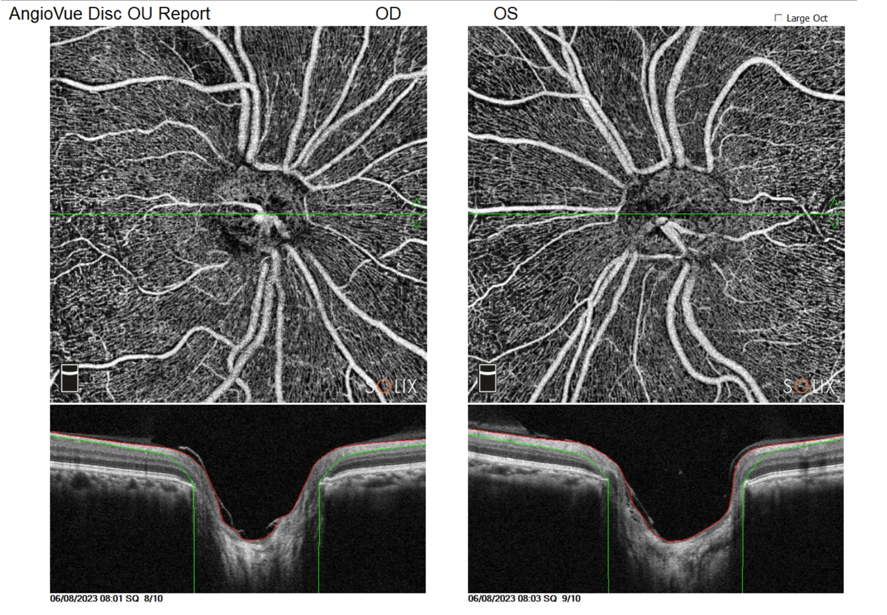
Careful inspection of the Solix report tells a different story. Starting at the top of the report, the color ONH photos are seen alongside the deviation maps. Of note, is an area ST to the ONH OD that is falling outside of the reference database (as seen by red/yellow coloration). Simultaneous viewing of the ONH photo reveals an RNFL or wedge defect in that location. Comparing the RNFL thickness between the eyes shows a 9-micron difference in the superior RNFL values between the eyes (3). OCT angiography of the radial peripapillary capillaries also highlights this wedge defect and can be seen by a dark color (navy) indicating less perfusion in this location (4).
Conclusion
This case highlights the importance of analyzing all aspects of the glaucoma report to make the correct diagnosis. Despite robust RNFL and GCC metrics, the Solix glaucoma protocol identified an abnormality OD that was substantiated with various visualization tools including retinal nerve fiber layer analysis, ganglion cell analysis, and vessel density metrics alongside a color ONH photo.
 Dr. Julie Rodman is the Chief of the Broward Eye Care Institute in Fort Lauderdale, FL and a Professor of Optometry at Nova Southeastern University. Her research interests include OCT/OCT-A and Vitreoretinal Disease. Dr. Rodman has authored over thirty publications with an emphasis on retinal disease. She recently published “Optical Coherence Tomography Atlas: A Case Study Approach,” the first reference book on this topic written by an optometrist. Dr. Rodman is a member of the AOA, AAO, FOA, and ORS. She has been the recipient of numerous teaching awards and was recognized as a Primary Care Optometry News “Top 300” Optometrists and “Newsweek Best Optometrists of 2021.”