[OCT Observations] Dry Eye multimodal imaging by OCT
![[OCT Observations] Dry Eye multimodal imaging by OCT Image](https://blog.visionix.com/hs-fs/hubfs/eye-5248678_1280.jpg?width=1250&name=eye-5248678_1280.jpg)
Dry eye multimodal imaging by OCT
The remodeling of the corneal epithelium as well as its compensatory ability to maintain a biomechanical balance of the cornea are known and its role is important for maintaining high optical quality. Continuous regeneration of epithelial cells is fundamental to ensure their functions, and several factors such as tear film, neuronal innervation, reflex blinking contribute to maintaining a favorable environment for the renewal of the corneal epithelium.
The morphology of the corneal epithelium during the different stages of dry eye has variable characteristics, associated with other analysis criteria available on our devices such as the evaluation of the meniscus of tears, meibography, and which thus offer a multimodal approach by OCT of the ocular surface.
Topography of normal corneal epithelium in OCT

Recent developments in OCT, particularly in terms of axial resolution, allow us, thanks to segmentation tools, to isolate the layer of the corneal epithelium by automatically detecting the tear film and the epithelium-Bowman layer interface. The software then makes it possible to generate a topography of the corneal epithelium of 6 × 6 mm, 9 × 9 mm and now even 10 × 10 mm thus offering a better correlation with the corneal topography (Figure 1). One of the most efficient devices is currently the SOLIX™ (Visionix, Fremont, USA) with which we have carried out this work.
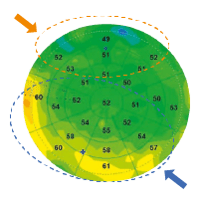
In OCT, the non-invasive measurement of the corneal epithelium includes the tear film, and the average thickness according to Y. Li et al. [2] would be in a normal subject of 52.3 ± 3.6 μm in the center, 49.6 ± 3.5 μm in upper and 51.2 ± 3.4 μm below, which corroborates the work carried out with Artemis (Figure 2).


A study, conducted by A.J. Kanellopoulos and G. Asimellis [3], showed some accuracy of OCT measurements of the corneal epithelium with a repeatability of measurements of 1 μm and a variability of topographic thickness of the order of 0.25 μm. This precision is important to remember when we know the small variations, of a few microns, of the modifications of the corneal epithelium.
Epithelial remodeling and dry eye
The measurement of the corneal epithelium in OCT offers a projection of the state of the ocular surface not only because it includes the tear film [4], but also because epithelial pachymetry varies according to the condition of the ocular surface. The remodeling of the corneal epithelium as well as its compensatory ability to maintain a biomechanical balance of the cornea are known, and its role is important for maintaining high optical quality.
In dry eye at the beginning stage, epithelial pachymetry highlights hyperplasia of the corneal epithelium with a predominance of the corneal apex in the lower. The level of hyperplasia also seems closely related to the level of meibomian dysfunction, and it is thus common to find a more pronounced hyperplasia on the eye with more advanced Meibomian dysfunction (Figure 3 L). The hyperplastic zone of the epithelium often corresponds to the corneal location where the first signs of tear film rupture are observed during the break-up time examination (Figure 4 R).
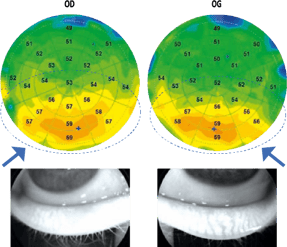
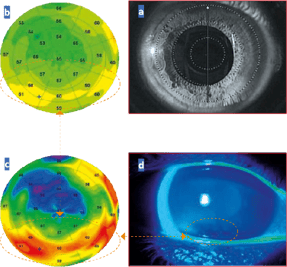
Figure 3 (L). Patient, aged 27 years, with a blepharitis chart of accommodative origin which presents a bilateral epithelial hyperplasia in the lower apex, of more pronounced appearance of the right eye where the meibography shows a dysfunction of the meibomian glands more accentuated.
Figure 4 (R) a. Image of the patient's cornea with OCT infrared camera during image acquisition.
b. Epithelial pachymetric topography revealing crescent-shaped hyperplasia at the lower apex.
c. Pachymetric epithelial topography with standardized scale highlighting this hyperplasia more prominently.
d. Correlation of the breakup time examination showing a rupture of the tear film associated with some traces of superficial.
This hyperplasia can be found in other corneal locations depending on the chronicity of dry eye (Figure 5). Immunofluorescence studies on mouse models with induced dry eye in a controlled environment chamber have demonstrated, thanks to the demonstration of the Ki-67 protein (marker of cell proliferation), hyperplasia of corneal epithelial cells [5]. This epithelial hyperplasia seems to be of reactive origin and related to induced microlesions whether due to hyperosmolar stress or the microabrasive effect of blinking for the maintenance of the ocular surface in moderate dryness. The mechanisms are not yet fully elucidated, but the most likely hypothesis would be that dry eye could be the cause of neurogenic inflammation or not and that the increase in pro-inflammatory cytokines would be involved in cell proliferation and keratinization [6, 7].
After a treatment combining eyelid hygiene with heating mask and wetting agent in 1st intention, there is an almost complete resorption of the appearance of epithelial hyperplasia by normalization of the ocular surface after improvement of blepharitis (Figure 6). The regression of epithelial hyperplasia highlights that these changes are indeed related to ocular surface disorders, which also explains the impact of ocular surface disorders on keratometry, the refraction of our patients, and therefore their visual instability. On the other hand, this correlation between the areas of hyperplasia of the corneal epithelium and the area of the first signs of tear film rupture suggests a mechanism of self-regulation between the corneal epithelium and the tear film to guarantee a certain optical quality.
The hyperplasia of the corneal epithelium observed on OCT epithelial topographies in dry eye could be compensatory at the beginning of the disease; then, trophic degradation would occur during the chronic phase of the disease, as evidenced by the epithelial thinning observed. Indeed, subsequently a decrease in tears will induce an increase in the frequency of blinking and lead to a more increased mechanical friction and thus to a more marked thinning at the top of the apex.
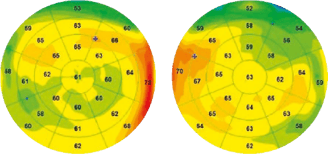
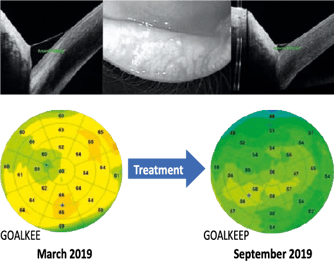
Figure 5 (L). Reactive epithelial hyperplasia whose localization is more irregular with a larger surface area in a context of chronic blepharitis of accommodative origin in a patient aged 50 years not wearing her optical correction.
Figure 6 (R). Follow-up of a 45-year-old patient with blepharitis associated with reactive hyperplasia of the corneal epithelium and a certain volume of basal lacrimal meniscus objectified by an OCT sectional image. After 6 months of treatment, there is a quasi-normalization of the epithelial map and a reduction in the volume of the meniscus of tears with an improvement in break-up time.
In the more severe stages, there is a more marked and diffuse overall epithelial thinning (Figure 7) [8, 9]. Indeed, by pursuing our reasoning, it has been shown that the abnormal proliferation of cells of the conjunctival and corneal epithelium is correlated with an abnormal production of proteins that can induce apoptosis. Excessive apoptosis or mechanical destruction of the corneal epithelium, if not compensated by rapid renewal, can lead to overall thinning of the corneal epithelium in cases of severe dry eye.
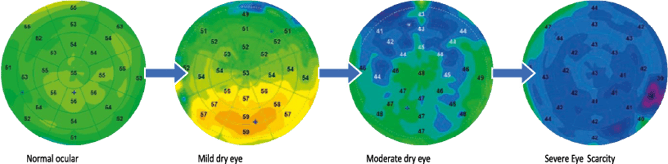 Figure 7. Proposal for classification of dry eye from epithelial maps
N.A. Edorh et al. [10] showed a statistically significant correlation of epithelial maps with break-up time and Schirmer's test and demonstrated compared to a control group that thinning of the corneal epithelium, especially above the apex, is a factor in detecting dry eye with a threshold value of the corneal epithelium of 50 μm. Hyperplasia was not demonstrated in this study because of a probable recruitment bias of patients from a specialist dry eye consultation with more advanced dry eye stages.
Epithelial mapping is becoming an interesting tool, in parallel with clinical examination, to objectify and quantify the quality of the ocular surface both in the initial assessment and in the follow-up of chronic ocular surface disorders [11].
Meibography and assessment of tear volume
Meibography has become an essential analysis for assessing meibomian dysfunction and its severity. Now, some OCT devices have a module to take these shots from an infrared camera (Figure 8). It is also possible to obtain meibographic images on each OCT machine by diverting the use of the infrared camera as in this case with the Mirante™ (Nidek, Japan) (Figure 9).
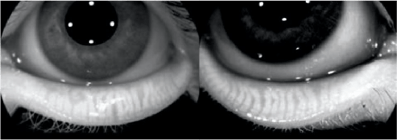
Figure 8 (L). Meibography embedded in the OCT Solix™ platform evidencing a stage III meibomian dysfunction.
Figure 9 (R). Meibography, carried out using the Mirante™ retinograph's confocal camera in a roundabout way.
Cross-sectional OCT also makes it possible to perform imaging of the lower lacrimal meniscus with the measurement of its height and surface, thus materializing basal secretion (Figure 10). We can also objectify the extent of the folds of inferior conjunctivochalasis whose severity is correlated with the risk of dry eye (Figure 11).
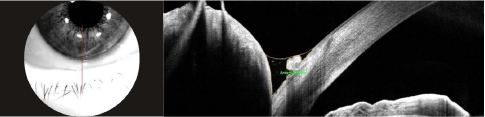 Figure 10. OCT imaging Vertical bscan (Solix™) of the lower lacrimal meniscus to quantify the height and surface area of basal secretion.
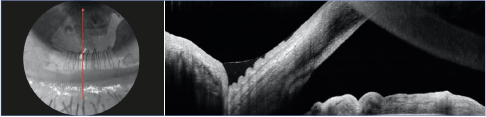
Figure 11. OCT imaging Bscan of the meniscus of lower tears highlighting the folds of conjunctivochalasis.
OCT in front of the cornea and dry eye
The OCT in front is a structural projection composed of many B-scans whose spacing will vary according to the density of the measuring points, which gives a certain resolution to the cubic analysis of this acquisition. This examination has already demonstrated its interest in retinal pathologies, but at the anterior segment its use was limited because of the low density of B-scans.
The recent increase in acquisition speed with the new spectral domain OCT devices allows a density of 256 B-scans, offering a beautiful projection of the cornea and its annexes.
The OCT in front allows us to highlight the instability of the lipid layer of the tear film by nuances of reflectivity of the tear film
(Figure 12). Some corneal pathologies associated with ocular surface disorders can be observed in OCT opposite, such as Cogan's dystrophy with its pathognomonic folds of the basement membrane (Figure 13) or adenovirus keratitis (Figure 14), with follow-up that can be done in conjunction with epithelial mapping.
This projection is a complementary visualization in a multimodal approach to dry eye by OCT.
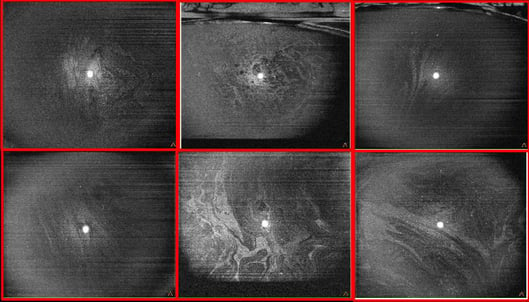 Figure 12. OCT in front of the tear film (cube 8 × 8 mm, Solix™) with visualization of the lipid layer and its instability through different clinical cases.
 SD-OCT: 120 000 A-scan/sec.
Axial Resolution: 5μm
OCT EN FACE: 256 Bcans
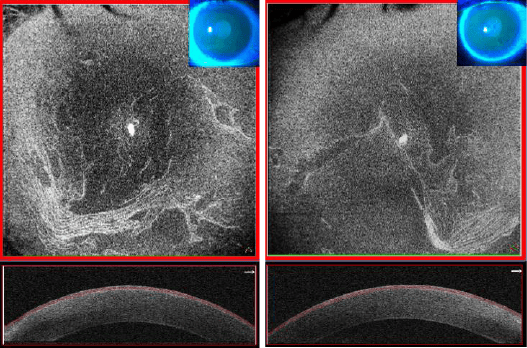 Figure 13. OCT in front of the cornea (cube 8 × 8 mm, Solix™) in a context of Cogan dystrophy with its folds of the basement membrane of the corneal epithelium of more pronounced appearance on the right eye.
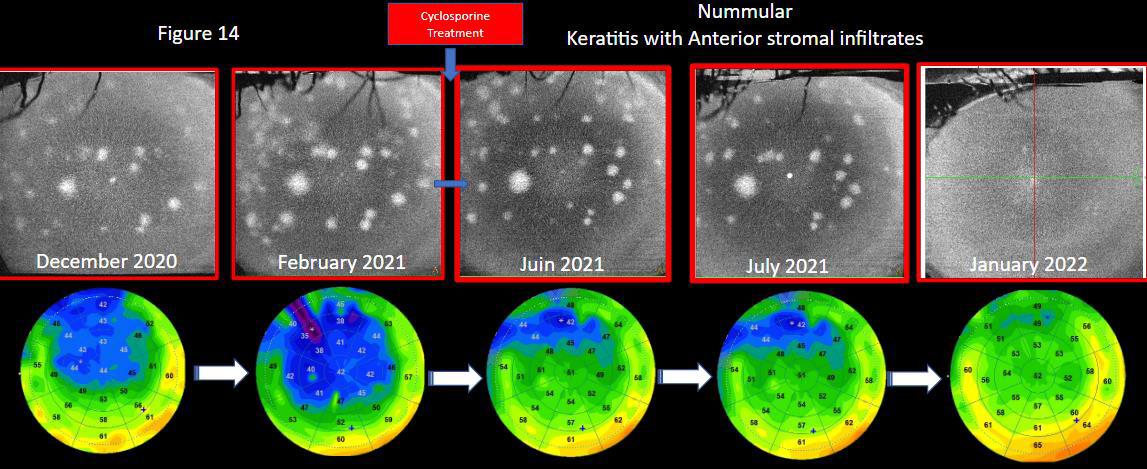 Figure 14. Follow-up of a patient with adenovirus keratitis with its aspects of nummular opacities in the anterior stroma and well quantified by OCT in front (cube 8 × 8 mm, Solix™). Epithelial mapping highlights by this thinning of the epithelium the associated ocular surface disorders. After the implementation of ciclosporin treatment, multimodality in OCT highlights the improvement of the surface by a re-thickening of the epithelium and a gradual decrease in opacities.
Clinical diagnostic perspectives
The modifications of the epithelium during the initial assessment and monitoring of dry eye will offer quantitative data not dependent on the operator, making it possible to assess certain changes felt by the patient, but not always well materialized by the examination of the break-up time depending on the operator, but also on the volume of fluorescein instilled. The multimodality available on OCT platforms, including meibography, measurement of the lower meniscus of tears and analysis of the corneal epithelial profile, will make it possible to inform the initial assessment of dry eye in parallel with the clinical examinati on and to objectively monitor the patient's evolution during his treatment (Figure 15).
In search of a certain biometric precision in so-called "premium" surgery, whether for multifocal or toric implants or in corneal surgery, the comparison between epithelial topography and corneal topography is essential to optimize the measurement of keratometric values [12].
The correlation between corneal topography and epimapping highlights that epithelial changes induce changes in corneal curvature with attenuation of keratometry in areas where epithelial hyperplasia exists (Figure 16).
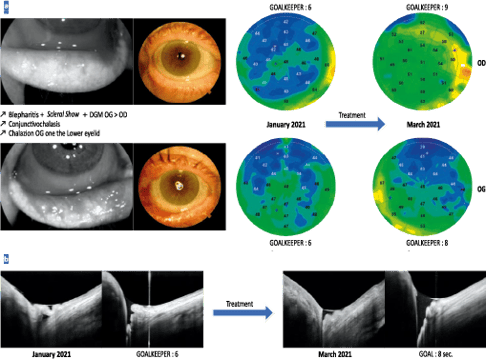
Figure 15. a. Follow-up of a patient, aged 66 years, with a blepharitis table combining a scleral show with numerous folds of conjunctivochalasis and a significant meibomian dysfunction of more pronounced appearance on the left eye. After a treatment including eyelid care, wetting agent and blink rehabilitation, there is an improvement in the epithelial profile with rethickening of the corneal epithelium and increased breakup time.
b. Analysis of the patient’s lower lacrimal meniscus shows, after treatment, a decrease in the folds of conjunctivochalasis responsible for filling the meniscus with tears and causing the reappearance of a certain basal volume.
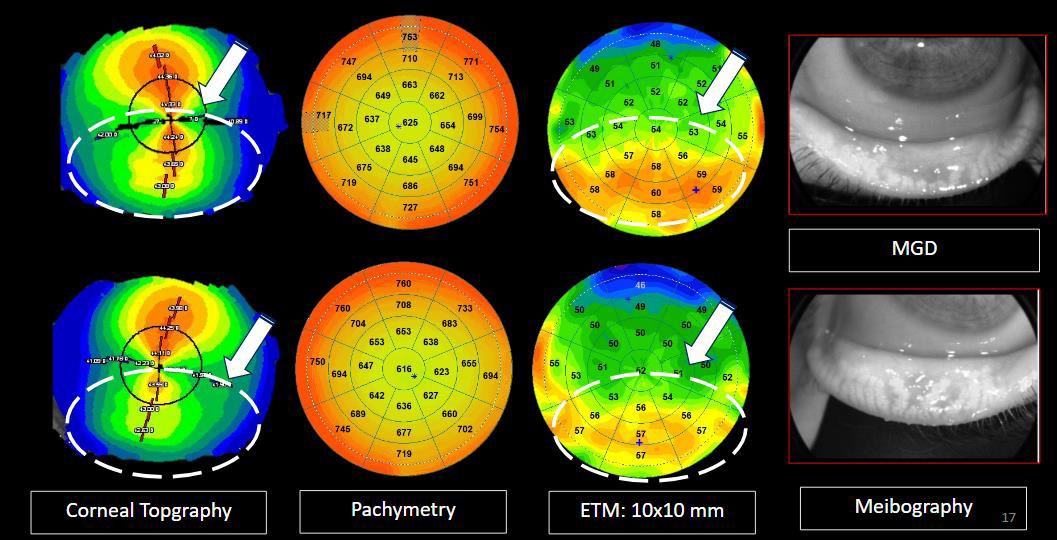
Figure 16. Young woman, aged 27, with a history of dust mite allergy, candidate for refractive surgery and who has a suspicious irregular corneal topography. The correlation with epithelial mapping highlights hyperplasia of the bilateral epithelium in the lower apex associated with dysfunction of the Meibomian glands modifying the lower corneal curvature. Note a more pronounced hyperplasia of the right eye where atrophy of the meibomian glands is more important.
Conclusion
The topography of the corneal epithelium seems to be a very interesting tool for obtaining a projection of the quality of the objective ocular surface due to changes in corneal epithelial cells during dry eye. OCT becomes a multimodal platform for dry eye analysis with meibography, meniscus measurement of tears, OCT in front of the cornea and epithelial mapping.
This new approach and quantification will most likely become a standard for dry eye analysis in the future, whether in screen ing or follow-up or in the initial assessment in refractive surgery.
A. El Maftouhi states that he has links of interest with Visionix (consultant).
C. Baudoin declares that he has no links of interest in relation to this article.
References
1. Reinstein DZ et al. Epithelial thickness in normal cornea: three-dimensional display with Artemis very high frequency digital ultrasound. J Refract Surg 2008;24:571-81.
2. Li Y et al. Corneal epithelial thickness mapping by Fourier-domain optical coherence tomography in normal and keratoconic eyes. Ophthalmology 2012;119:2425-33.
3. Kanellopoulos AJ, Asimellis G. In vivo 3-dimensional corneal epithelial thickness mapping as an indicator of dry eye: preliminary clinical assessment. Am J Ophthalmol 2014;157:63-68.e2e.
4. Cui X Hong J et al. Assessment of corneal epithelial thickness in dry eye patients. Optom vis sci 2014;91:1446-54.
5. Fabiani C et al. Corneal epithelial proliferation and thickness in a mouse model of dry eye. Exp Eye Res 2009;89:166-71.
6. Baudouin C et al. Role of hyperosmolarity in the pathogenesis and management of dry eye disease: proceedings of the OCEAN group meeting. Ocul Surf 2013;11:246-58.
7. Baudouin C et al. Revisiting the vicious circle of dry eye disease: a focus on the pathophysiology of meibomian gland dysfunction. Br J Ophthalmol 2016; 100:300-6.
8. El Maftouhi A, Baudouin C. OCT and dry eye. Les Cahiers d'Ophtalmologie 2019; 225:32-7.
9. King-Smith PE et al. The thickness of the tear film. Curr Eye Res 2004; 29:357-68.
10. Edorh NA et al. New model to better diagnose dry eye disease integrating OCT corneal epithelial mapping. Br J Ophthalmol 2022;106(11):1488-95.
11. El Maftouhi A, Denoyer A. OCT: the intelligence of the corneal epithelium. Les Cahiers d'ophtalmologie 2022;252:28-32.
12. El Maftouhi A , Denoyer A. What is the place of OCT in the refractive surgery assessment? Ophthalmogic reflections 2020; 231:28-32.
The information provided is for general informational purposes only. It is not intended to replace and should not be considered a substitute for professional medical advice, diagnosis, or treatment.
The content is not designed to replace the relationship between a patient and their healthcare provider. Any medical decision should be made in consultation with a qualified healthcare professional who can provide information tailored to your individual situation.
Medical procedures, case studies, and practices mentioned in this content may vary depending on regional standards, local regulations, and the discretion of the healthcare provider. What may be considered appropriate and ethical in one country may differ in another.
The content may include general references to medical practices, medications, or treatments that are widely accepted in certain regions but may not be universally applicable or approved. It is important to consult a healthcare professional in your jurisdiction to ensure that the information is relevant to your specific situation.
The authors, editors, and contributors of this content disclaim any liability for any adverse effects resulting directly or indirectly from the information contained herein. Readers should exercise their own judgment and seek advice from healthcare professionals when necessary. By accessing and using this content, you acknowledge and accept the terms of this disclaimer.


Mr. Adil El Maftouhi is Orthoptist and Ocular imaging specialist in Centre Ophtalmologique de Rive Geneva, Switzerland and in CHNO XV-XX Paris, France. He is the author of international books on OCT and OCT-A. He has also published several peer-reviewed articles like "OCT and dry eye syndrome" and « OCT : the intelligence of the epithelium ».
Adil El Maftouhi works on the development and operation of the various imaging systems available in Ophthalmology to exploit the potential of each system for the benefit of the clinic.
At the same time, he contributes to the development of new imaging applications and software, particularly on OCT technology. Mr. El Maftouhi also participates in clinical and pharmacological research projects in the field of medical retina, glaucoma and low vision.